|
FY2017 House 1 |
FY2017 House Final |
FY2017 Senate Final |
FY2017 GAA |
|
|---|---|---|---|---|
| Budget Tracking | 1,641,331,829 | 1,643,114,709 | 1,643,114,709 | 1,637,028,930 |
|
FY2014 GAA |
FY2015 GAA |
FY2016 GAA |
FY2016 Projected |
FY2017 GAA |
|
|---|---|---|---|---|---|
| Historical Budget Levels | 1,272,894,957 | 1,391,500,896 | 1,596,665,738 | 1,568,624,196 | 1,637,028,930 |
* GAA is General Appropriation Act.
| SPENDING CATEGORY |
FY2013 Expended |
FY2014 Expended |
FY2015 Expended |
FY2016 Projected |
FY2017 GAA |
|---|---|---|---|---|---|
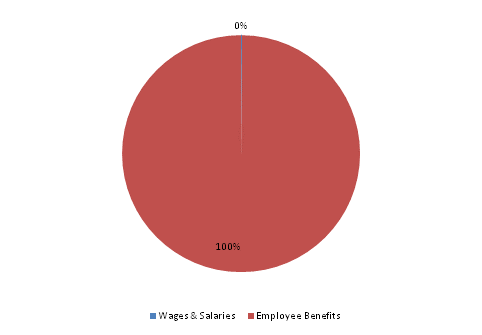
| Wages & Salaries | 1,905 | 2,206 | 2,192 | -30,234 | 2,161 |
| Employee Benefits | 1,214,490 | 1,336,488 | 1,578,777 | 1,598,688 | 1,634,868 |
| Operating Expenses | 0 | 0 | 0 | 170 | 0 |
| TOTAL | 1,216,395 | 1,338,693 | 1,580,969 | 1,568,624 | 1,637,029 |
FY2017 Spending Category Chart
