|
FY2017 House 1 |
FY2017 House Final |
FY2017 Senate Final |
FY2017 GAA |
|
|---|---|---|---|---|
| Budget Tracking | 2,271,489 | 2,371,489 | 2,371,489 | 2,271,489 |
|
FY2014 GAA |
FY2015 GAA |
FY2016 GAA |
FY2016 Projected |
FY2017 GAA |
|
|---|---|---|---|---|---|
| Historical Budget Levels | 2,230,721 | 2,312,772 | 2,271,489 | 2,341,489 | 2,271,489 |
* GAA is General Appropriation Act.
| SPENDING CATEGORY |
FY2013 Expended |
FY2014 Expended |
FY2015 Expended |
FY2016 Projected |
FY2017 GAA |
|---|---|---|---|---|---|
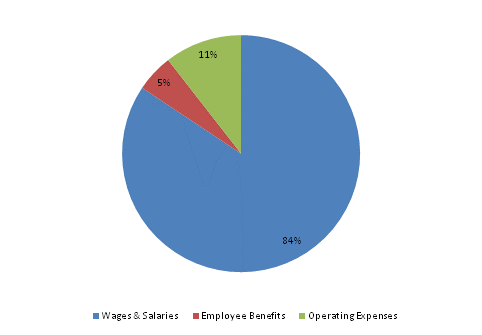
| Wages & Salaries | 1,742 | 1,773 | 1,955 | 1,986 | 1,916 |
| Employee Benefits | 65 | 121 | 122 | 116 | 116 |
| Operating Expenses | 393 | 359 | 165 | 239 | 239 |
| TOTAL | 2,200 | 2,253 | 2,242 | 2,341 | 2,271 |
FY2017 Spending Category Chart
