|
FY2017 House 1 |
FY2017 House Final |
FY2017 Senate Final |
FY2017 GAA |
|
|---|---|---|---|---|
| Budget Tracking | 237,872,058 | 237,872,058 | 237,872,058 | 239,872,058 |
|
FY2014 GAA |
FY2015 GAA |
FY2016 GAA |
FY2016 Projected |
FY2017 GAA |
|
|---|---|---|---|---|---|
| Historical Budget Levels | 218,967,364 | 219,523,472 | 214,812,830 | 231,767,015 | 239,872,058 |
* GAA is General Appropriation Act.
| SPENDING CATEGORY |
FY2013 Expended |
FY2014 Expended |
FY2015 Expended |
FY2016 Projected |
FY2017 GAA |
|---|---|---|---|---|---|
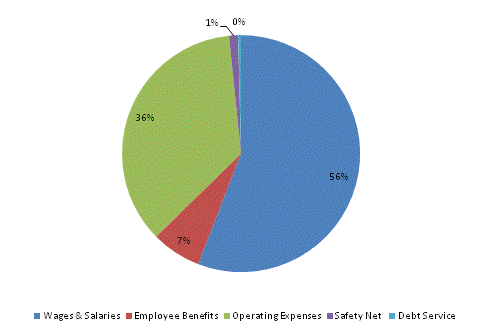
| Wages & Salaries | 110,932 | 114,022 | 112,660 | 126,883 | 134,106 |
| Employee Benefits | 13,356 | 14,267 | 15,303 | 16,124 | 16,260 |
| Operating Expenses | 80,684 | 81,449 | 81,928 | 84,873 | 85,587 |
| Safety Net | 2,985 | 3,046 | 3,059 | 2,918 | 2,942 |
| Debt Service | 242 | 657 | 657 | 970 | 978 |
| TOTAL | 208,199 | 213,441 | 213,606 | 231,767 | 239,872 |
FY2017 Spending Category Chart
