Budget Detail
9600-0000 - House of Representatives Operations
Data Current as of: 8/9/2016
|
FY2017 House 1 |
FY2017 House Final |
FY2017 Senate Final |
FY2017 GAA |
|
|---|---|---|---|---|
| Budget Tracking | 40,277,604 | 40,277,604 | 41,485,932 | 40,277,604 |
|
FY2014 GAA |
FY2015 GAA |
FY2016 GAA |
FY2016 Projected |
FY2017 GAA |
|
|---|---|---|---|---|---|
| Historical Budget Levels | 38,337,716 | 39,104,470 | 38,404,500 | 57,646,600 | 40,277,604 |
* GAA is General Appropriation Act.
| SPENDING CATEGORY |
FY2013 Expended |
FY2014 Expended |
FY2015 Expended |
FY2016 Projected |
FY2017 GAA |
|---|---|---|---|---|---|
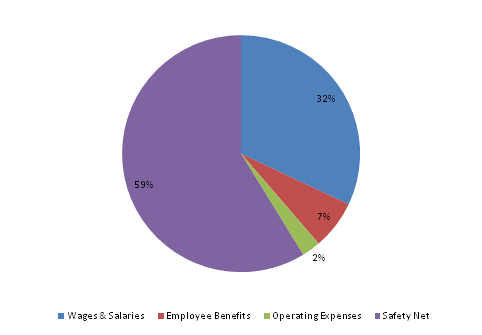
| Wages & Salaries | 31,178 | 31,127 | 31,397 | 30,391 | 12,890 |
| Employee Benefits | 890 | 899 | 956 | 2,682 | 2,682 |
| Operating Expenses | 362 | 446 | 431 | 905 | 1,037 |
| Safety Net | 0 | 0 | 0 | 23,668 | 23,668 |
| TOTAL | 32,430 | 32,471 | 32,784 | 57,647 | 40,278 |
FY2017 Spending Category Chart
