Quick Links
- Statewide Summary
- Judiciary
- Independents
- Administration and Finance
- Administration & Finance
- Dev. Disabilities Council
- Capital Asset Management
- Bureau of the State House
- Office on Disability
- Teachers' Retirement Board
- Group Insurance
- Administrative Law Appeals
- George Fingold Library
- Dept. of Revenue
- Appellate Tax Board
- Health Policy Commission
- Human Resources Division
- Civil Service Commission
- Operational Services Division
- Mass IT
- Energy & Environmental Affairs
- Health and Human Services
- Transportation
- Housing & Economic Development
- Labor & Workforce Development
- Education
- Public Safety
- Legislature
- All Account Listing
- Veto Listing
- Local Aid - Section 3
- Outside Sections
- Downloads
- Budget Glossary
- Helpful Links
|
FY2017 House 1 |
FY2017 House Final |
FY2017 Senate Final |
FY2017 GAA |
|
|---|---|---|---|---|
| Budget Tracking | 77,536,444 | 77,536,444 | 77,536,443 | 76,436,443 |
|
FY2014 GAA |
FY2015 GAA |
FY2016 GAA |
FY2016 Projected |
FY2017 GAA |
|
|---|---|---|---|---|---|
| Historical Budget Levels | 89,668,584 | 94,179,565 | 88,872,929 | 75,663,726 | 76,436,443 |
* GAA is General Appropriation Act.
| SPENDING CATEGORY |
FY2013 Expended |
FY2014 Expended |
FY2015 Expended |
FY2016 Projected |
FY2017 GAA |
|---|---|---|---|---|---|
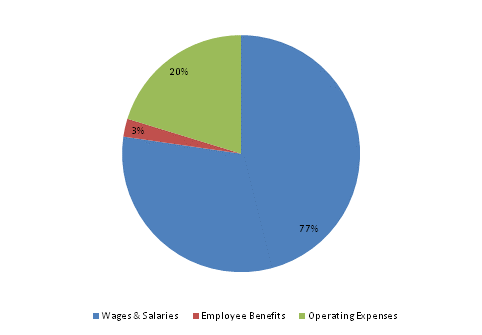
| Wages & Salaries | 68,972 | 72,616 | 71,152 | 58,007 | 59,083 |
| Employee Benefits | 1,717 | 1,803 | 1,915 | 1,843 | 1,864 |
| Operating Expenses | 15,088 | 15,092 | 16,412 | 15,774 | 15,490 |
| Debt Service | 0 | 0 | 0 | 40 | 0 |
| TOTAL | 85,777 | 89,512 | 89,479 | 75,664 | 76,436 |
FY2017 Spending Category Chart
