| SPENDING CATEGORY |
FY2012 Expended |
FY2013 Expended |
FY2014 Expended |
FY2015 Projected |
FY2016 GAA |
|---|---|---|---|---|---|
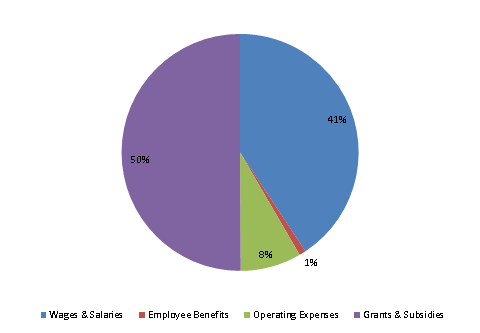
| Wages & Salaries | 17,854 | 17,833 | 18,794 | 19,918 | 20,254 |
| Employee Benefits | 533 | 411 | 385 | 480 | 451 |
| Operating Expenses | 3,773 | 4,433 | 4,346 | 7,889 | 4,137 |
| Grants & Subsidies | 13,869 | 15,651 | 19,108 | 24,961 | 24,915 |
| TOTAL | 36,029 | 38,328 | 42,633 | 53,248 | 49,758 |
FY2016 Spending Category Chart
