| SPENDING CATEGORY |
FY2012 Expended |
FY2013 Expended |
FY2014 Expended |
FY2015 Projected |
FY2016 GAA |
|---|---|---|---|---|---|
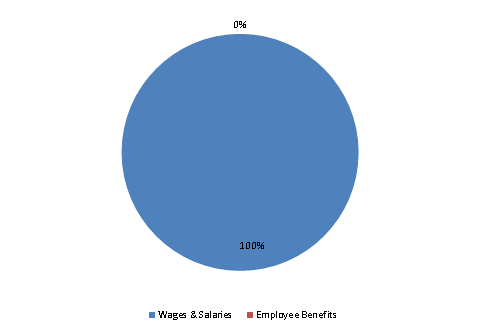
| Wages & Salaries | 20,673 | 20,957 | 21,420 | 23,763 | 24,169 |
| Employee Benefits | 416 | 275 | 317 | 0 | 2 |
| Operating Expenses | 240 | 291 | 881 | 0 | 0 |
| Grants & Subsidies | 0 | 0 | 60 | 0 | 0 |
| TOTAL | 21,329 | 21,523 | 22,679 | 23,763 | 24,171 |
FY2016 Spending Category Chart
