| SPENDING CATEGORY |
FY2012 Expended |
FY2013 Expended |
FY2014 Expended |
FY2015 Projected |
FY2016 GAA |
|---|---|---|---|---|---|
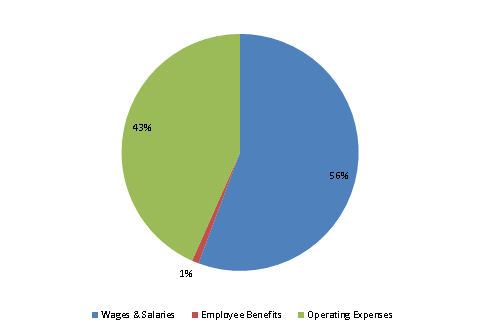
| Wages & Salaries | 11,916 | 10,424 | 11,797 | 18,248 | 17,351 |
| Employee Benefits | 173 | 150 | 152 | 273 | 285 |
| Operating Expenses | 8,611 | 9,907 | 10,374 | 14,369 | 13,505 |
| TOTAL | 20,700 | 20,480 | 22,323 | 32,890 | 31,141 |
FY2016 Spending Category Chart
