|
FY2016 House 1 |
FY2016 House Final |
FY2016 Senate Final |
FY2016 GAA |
|
|---|---|---|---|---|
| Budget Tracking | 8,304,832 | 8,304,832 | 8,709,884 | 8,709,884 |
|
FY2013 GAA |
FY2014 GAA |
FY2015 GAA |
FY2015 Projected |
FY2016 GAA |
|
|---|---|---|---|---|---|
| Historical Budget Levels | 7,968,231 | 8,290,390 | 8,456,198 | 6,895,582 | 8,709,884 |
* GAA is General Appropriation Act.
| SPENDING CATEGORY |
FY2012 Expended |
FY2013 Expended |
FY2014 Expended |
FY2015 Projected |
FY2016 GAA |
|---|---|---|---|---|---|
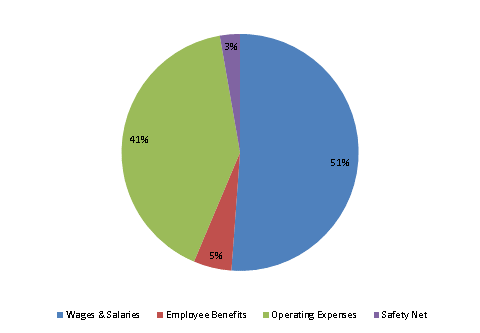
| Wages & Salaries | 1,961 | 2,070 | 2,104 | 860 | 4,457 |
| Employee Benefits | 31 | 22 | 29 | 430 | 451 |
| Operating Expenses | 5,734 | 5,794 | 4,421 | 5,377 | 3,562 |
| Safety Net | 0 | 0 | 0 | 228 | 239 |
| TOTAL | 7,727 | 7,886 | 6,554 | 6,896 | 8,710 |
FY2016 Spending Category Chart
