|
FY2016 House 1 |
FY2016 House Final |
FY2016 Senate Final |
FY2016 GAA |
|
|---|---|---|---|---|
| Budget Tracking | 106,667,534 | 103,574,920 | 106,667,534 | 104,595,483 |
|
FY2013 GAA |
FY2014 GAA |
FY2015 GAA |
FY2015 Projected |
FY2016 GAA |
|
|---|---|---|---|---|---|
| Historical Budget Levels | 97,780,898 | 98,752,624 | 104,411,964 | 104,639,081 | 104,595,483 |
* GAA is General Appropriation Act.
| SPENDING CATEGORY |
FY2012 Expended |
FY2013 Expended |
FY2014 Expended |
FY2015 Projected |
FY2016 GAA |
|---|---|---|---|---|---|
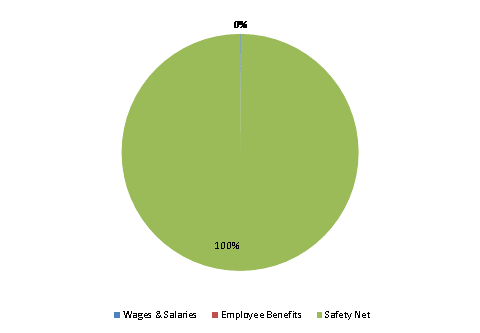
| Wages & Salaries | 67 | 67 | 95 | 98 | 102 |
| Employee Benefits | 2 | 1 | 2 | 3 | 3 |
| Safety Net | 97,615 | 97,382 | 99,483 | 104,538 | 104,491 |
| TOTAL | 97,684 | 97,449 | 99,580 | 104,639 | 104,595 |
FY2016 Spending Category Chart
