|
FY2016 House 1 |
FY2016 House Final |
FY2016 Senate Final |
FY2016 GAA |
|
|---|---|---|---|---|
| Budget Tracking | 101,063,703 | 99,492,346 | 105,463,003 | 104,492,346 |
|
FY2013 GAA |
FY2014 GAA |
FY2015 GAA |
FY2015 Projected |
FY2016 GAA |
|
|---|---|---|---|---|---|
| Historical Budget Levels | 90,397,267 | 94,647,693 | 97,065,703 | 98,264,899 | 104,492,346 |
* GAA is General Appropriation Act.
| SPENDING CATEGORY |
FY2012 Expended |
FY2013 Expended |
FY2014 Expended |
FY2015 Projected |
FY2016 GAA |
|---|---|---|---|---|---|
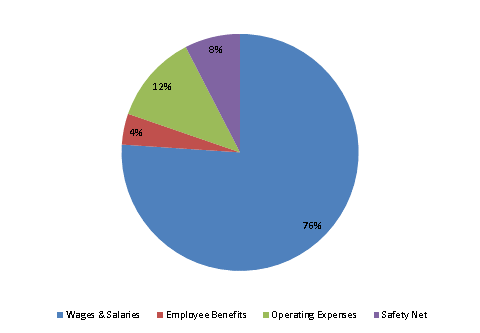
| Wages & Salaries | 71,092 | 73,320 | 75,359 | 94,878 | 79,470 |
| Employee Benefits | 5,441 | 4,680 | 4,314 | 1,026 | 4,411 |
| Operating Expenses | 11,833 | 11,002 | 10,247 | 2,361 | 12,695 |
| Safety Net | 5,282 | 5,379 | 5,644 | 0 | 7,916 |
| TOTAL | 93,648 | 94,381 | 95,564 | 98,265 | 104,492 |
FY2016 Spending Category Chart
