|
FY2016 House 1 |
FY2016 House Final |
FY2016 Senate Final |
FY2016 GAA |
|
|---|---|---|---|---|
| Budget Tracking | 54,051,129 | 54,478,550 | 54,051,129 | 54,051,129 |
|
FY2013 GAA |
FY2014 GAA |
FY2015 GAA |
FY2015 Projected |
FY2016 GAA |
|
|---|---|---|---|---|---|
| Historical Budget Levels | 27,783,339 | 36,121,305 | 53,149,805 | 58,231,446 | 54,051,129 |
* GAA is General Appropriation Act.
| SPENDING CATEGORY |
FY2012 Expended |
FY2013 Expended |
FY2014 Expended |
FY2015 Projected |
FY2016 GAA |
|---|---|---|---|---|---|
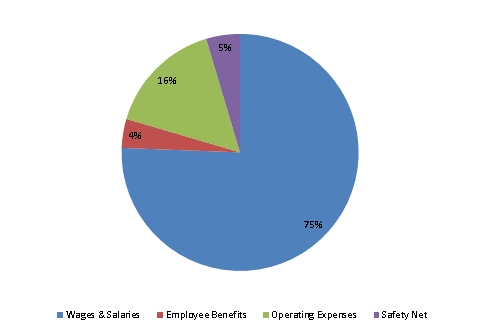
| Wages & Salaries | 24,418 | 28,854 | 33,012 | 44,595 | 40,864 |
| Employee Benefits | 997 | 861 | 992 | 2,035 | 2,134 |
| Operating Expenses | 4,748 | 5,916 | 4,767 | 9,101 | 8,553 |
| Safety Net | 1,059 | 587 | 570 | 2,500 | 2,500 |
| Grants & Subsidies | 0 | 0 | 2,100 | 0 | 0 |
| TOTAL | 31,222 | 36,219 | 41,441 | 58,231 | 54,051 |
FY2016 Spending Category Chart
