|
FY2016 House 1 |
FY2016 House Final |
FY2016 Senate Final |
FY2016 GAA |
|
|---|---|---|---|---|
| Budget Tracking | 41,740,253 | 39,252,046 | 44,134,993 | 43,752,046 |
|
FY2013 GAA |
FY2014 GAA |
FY2015 GAA |
FY2015 Projected |
FY2016 GAA |
|
|---|---|---|---|---|---|
| Historical Budget Levels | 28,001,984 | 31,059,463 | 38,294,679 | 40,415,943 | 43,752,046 |
* GAA is General Appropriation Act.
| SPENDING CATEGORY |
FY2012 Expended |
FY2013 Expended |
FY2014 Expended |
FY2015 Projected |
FY2016 GAA |
|---|---|---|---|---|---|
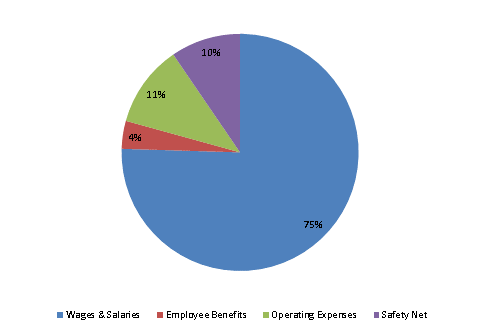
| Wages & Salaries | 25,198 | 26,003 | 31,529 | 33,041 | 33,023 |
| Employee Benefits | 1,522 | 1,445 | 1,490 | 1,626 | 1,664 |
| Operating Expenses | 3,260 | 3,886 | 4,168 | 4,827 | 4,890 |
| Safety Net | 0 | 2,182 | 372 | 923 | 4,174 |
| TOTAL | 29,980 | 33,516 | 37,559 | 40,416 | 43,752 |
FY2016 Spending Category Chart
