|
FY2016 House 1 |
FY2016 House Final |
FY2016 Senate Final |
FY2016 GAA |
|
|---|---|---|---|---|
| Budget Tracking | 28,239,453 | 27,811,118 | 28,332,445 | 28,061,118 |
|
FY2013 GAA |
FY2014 GAA |
FY2015 GAA |
FY2015 Projected |
FY2016 GAA |
|
|---|---|---|---|---|---|
| Historical Budget Levels | 22,531,834 | 24,224,899 | 27,132,798 | 27,505,261 | 28,061,118 |
* GAA is General Appropriation Act.
| SPENDING CATEGORY |
FY2012 Expended |
FY2013 Expended |
FY2014 Expended |
FY2015 Projected |
FY2016 GAA |
|---|---|---|---|---|---|
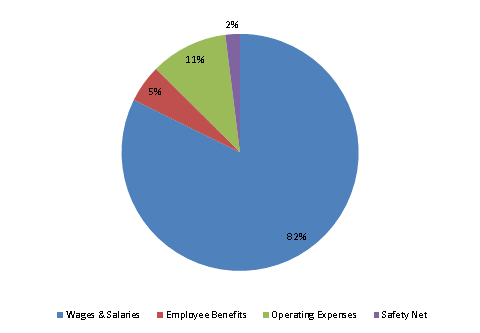
| Wages & Salaries | 19,736 | 21,142 | 22,226 | 22,659 | 23,097 |
| Employee Benefits | 1,547 | 1,491 | 1,476 | 1,475 | 1,441 |
| Operating Expenses | 2,653 | 3,157 | 2,938 | 2,947 | 2,965 |
| Safety Net | 289 | 260 | 409 | 424 | 558 |
| TOTAL | 24,225 | 26,049 | 27,049 | 27,505 | 28,061 |
FY2016 Spending Category Chart
