|
FY2016 House 1 |
FY2016 House Final |
FY2016 Senate Final |
FY2016 GAA |
|
|---|---|---|---|---|
| Budget Tracking | 173,952 | 200,000 | 200,000 | 200,000 |
|
FY2013 GAA |
FY2014 GAA |
FY2015 GAA |
FY2015 Projected |
FY2016 GAA |
|
|---|---|---|---|---|---|
| Historical Budget Levels | 158,248 | 200,000 | 200,000 | 170,348 | 200,000 |
* GAA is General Appropriation Act.
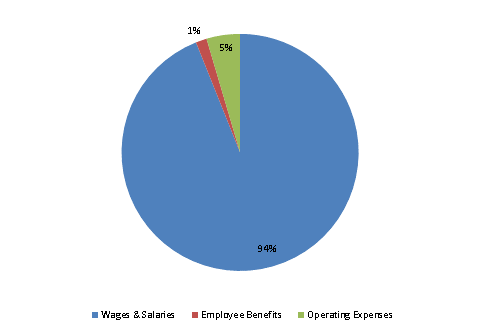
| SPENDING CATEGORY |
FY2012 Expended |
FY2013 Expended |
FY2014 Expended |
FY2015 Projected |
FY2016 GAA |
|---|---|---|---|---|---|
| Wages & Salaries | 134 | 137 | 146 | 160 | 188 |
| Employee Benefits | 4 | 3 | 4 | 2 | 3 |
| Operating Expenses | 19 | 17 | 9 | 8 | 9 |
| TOTAL | 158 | 158 | 158 | 170 | 200 |
FY2016 Spending Category Chart