|
FY2016 House 1 |
FY2016 House Final |
FY2016 Senate Final |
FY2016 GAA |
|
|---|---|---|---|---|
| Budget Tracking | 17,306,274 | 17,738,932 | 17,911,995 | 17,738,932 |
|
FY2013 GAA |
FY2014 GAA |
FY2015 GAA |
FY2015 Projected |
FY2016 GAA |
|
|---|---|---|---|---|---|
| Historical Budget Levels | 14,258,336 | 16,891,155 | 17,306,275 | 17,559,663 | 17,738,932 |
* GAA is General Appropriation Act.
| SPENDING CATEGORY |
FY2012 Expended |
FY2013 Expended |
FY2014 Expended |
FY2015 Projected |
FY2016 GAA |
|---|---|---|---|---|---|
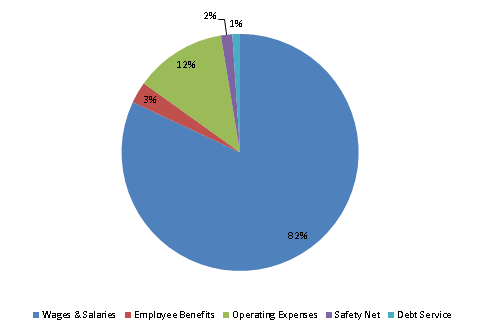
| Wages & Salaries | 11,250 | 11,973 | 12,972 | 13,844 | 14,540 |
| Employee Benefits | 760 | 443 | 813 | 669 | 520 |
| Operating Expenses | 3,150 | 2,747 | 2,831 | 2,701 | 2,219 |
| Safety Net | 331 | 274 | 235 | 345 | 275 |
| Debt Service | 0 | 0 | 0 | 0 | 185 |
| TOTAL | 15,491 | 15,437 | 16,850 | 17,560 | 17,739 |
FY2016 Spending Category Chart
