|
FY2016 House 1 |
FY2016 House Final |
FY2016 Senate Final |
FY2016 GAA |
|
|---|---|---|---|---|
| Budget Tracking | 11,421,347 | 11,550,402 | 14,682,242 | 14,682,242 |
|
FY2013 GAA |
FY2014 GAA |
FY2015 GAA |
FY2015 Projected |
FY2016 GAA |
|
|---|---|---|---|---|---|
| Historical Budget Levels | 8,875,657 | 10,153,425 | 11,146,734 | 11,663,451 | 14,682,242 |
* GAA is General Appropriation Act.
| SPENDING CATEGORY |
FY2012 Expended |
FY2013 Expended |
FY2014 Expended |
FY2015 Projected |
FY2016 GAA |
|---|---|---|---|---|---|
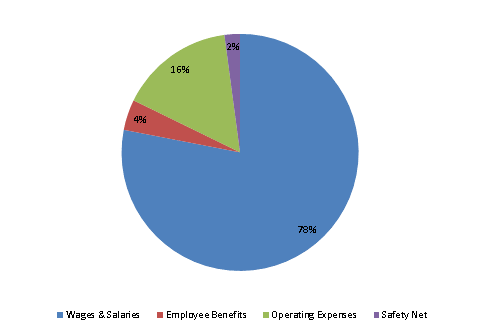
| Wages & Salaries | 7,405 | 7,687 | 8,632 | 8,136 | 11,459 |
| Employee Benefits | 503 | 546 | 533 | 565 | 614 |
| Operating Expenses | 1,932 | 2,061 | 1,881 | 2,646 | 2,299 |
| Safety Net | 264 | 237 | 269 | 317 | 311 |
| TOTAL | 10,103 | 10,530 | 11,315 | 11,663 | 14,682 |
FY2016 Spending Category Chart
