|
FY2016 House 1 |
FY2016 House Final |
FY2016 Senate Final |
FY2016 GAA |
|
|---|---|---|---|---|
| Budget Tracking | 70,310,139 | 66,582,545 | 68,032,131 | 67,382,545 |
|
FY2013 GAA |
FY2014 GAA |
FY2015 GAA |
FY2015 Projected |
FY2016 GAA |
|
|---|---|---|---|---|---|
| Historical Budget Levels | 60,918,825 | 62,430,080 | 64,958,580 | 66,666,747 | 67,382,545 |
* GAA is General Appropriation Act.
| SPENDING CATEGORY |
FY2012 Expended |
FY2013 Expended |
FY2014 Expended |
FY2015 Projected |
FY2016 GAA |
|---|---|---|---|---|---|
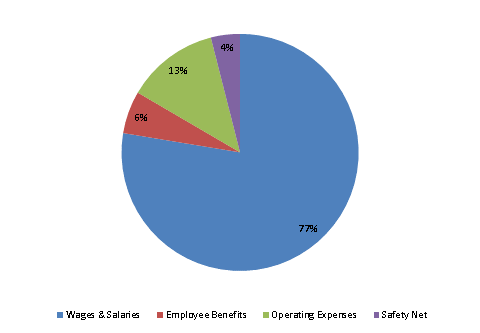
| Wages & Salaries | 46,057 | 48,326 | 51,586 | 52,393 | 52,291 |
| Employee Benefits | 4,157 | 3,640 | 3,987 | 4,178 | 3,914 |
| Operating Expenses | 9,248 | 7,643 | 7,960 | 7,730 | 8,498 |
| Safety Net | 2,967 | 2,977 | 2,439 | 2,366 | 2,679 |
| TOTAL | 62,430 | 62,586 | 65,973 | 66,667 | 67,383 |
FY2016 Spending Category Chart
