|
FY2016 House 1 |
FY2016 House Final |
FY2016 Senate Final |
FY2016 GAA |
|
|---|---|---|---|---|
| Budget Tracking | 45,424,583 | 45,700,854 | 45,924,583 | 45,924,583 |
|
FY2013 GAA |
FY2014 GAA |
FY2015 GAA |
FY2015 Projected |
FY2016 GAA |
|
|---|---|---|---|---|---|
| Historical Budget Levels | 40,282,336 | 42,688,571 | 44,586,199 | 44,716,457 | 45,924,583 |
* GAA is General Appropriation Act.
| SPENDING CATEGORY |
FY2012 Expended |
FY2013 Expended |
FY2014 Expended |
FY2015 Projected |
FY2016 GAA |
|---|---|---|---|---|---|
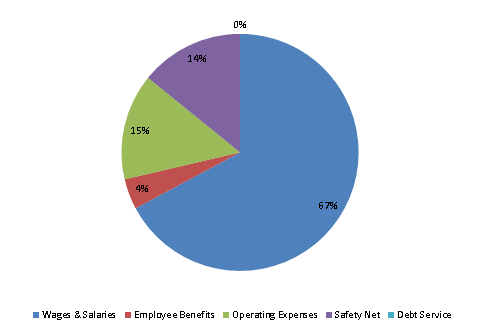
| Wages & Salaries | 28,389 | 27,324 | 28,687 | 30,416 | 30,851 |
| Employee Benefits | 2,508 | 2,429 | 2,240 | 2,404 | 1,911 |
| Operating Expenses | 5,340 | 5,589 | 6,845 | 6,399 | 6,660 |
| Safety Net | 4,327 | 5,428 | 5,428 | 5,059 | 6,497 |
| Debt Service | 11 | 68 | 437 | 439 | 5 |
| TOTAL | 40,574 | 40,838 | 43,637 | 44,716 | 45,925 |
FY2016 Spending Category Chart
