|
FY2016 House 1 |
FY2016 House Final |
FY2016 Senate Final |
FY2016 GAA |
|
|---|---|---|---|---|
| Budget Tracking | 567,483,603 | 570,101,603 | 570,151,603 | 570,151,603 |
|
FY2013 GAA |
FY2014 GAA |
FY2015 GAA |
FY2015 Projected |
FY2016 GAA |
|
|---|---|---|---|---|---|
| Historical Budget Levels | 541,217,210 | 547,113,917 | 561,699,788 | 566,536,501 | 570,151,603 |
* GAA is General Appropriation Act.
| SPENDING CATEGORY |
FY2012 Expended |
FY2013 Expended |
FY2014 Expended |
FY2015 Projected |
FY2016 GAA |
|---|---|---|---|---|---|
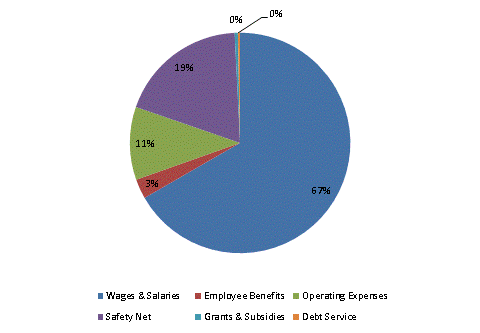
| Wages & Salaries | 333,205 | 358,509 | 379,292 | 383,497 | 380,211 |
| Employee Benefits | 16,940 | 14,159 | 15,400 | 16,523 | 16,491 |
| Operating Expenses | 60,736 | 59,640 | 59,613 | 62,557 | 61,110 |
| Safety Net | 105,737 | 106,590 | 99,635 | 103,228 | 107,833 |
| Grants & Subsidies | 1,450 | 2,050 | 2,548 | 0 | 2,668 |
| Debt Service | 62 | 0 | 731 | 731 | 1,840 |
| TOTAL | 518,131 | 540,948 | 557,219 | 566,537 | 570,152 |
FY2016 Spending Category Chart
