|
FY2016 House 1 |
FY2016 House Final |
FY2016 Senate Final |
FY2016 GAA |
|
|---|---|---|---|---|
| Budget Tracking | 2,216,482 | 3,079,482 | 2,716,406 | 3,374,406 |
|
FY2013 GAA |
FY2014 GAA |
FY2015 GAA |
FY2015 Projected |
FY2016 GAA |
|
|---|---|---|---|---|---|
| Historical Budget Levels | 2,212,797 | 2,072,230 | 3,208,750 | 2,226,489 | 3,374,406 |
* GAA is General Appropriation Act.
| SPENDING CATEGORY |
FY2012 Expended |
FY2013 Expended |
FY2014 Expended |
FY2015 Projected |
FY2016 GAA |
|---|---|---|---|---|---|
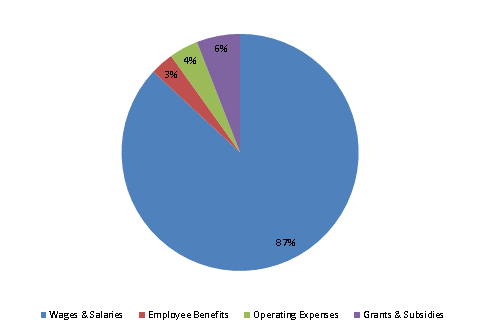
| Wages & Salaries | 1,858 | 1,921 | 1,737 | 1,850 | 2,933 |
| Employee Benefits | 52 | 95 | 103 | 34 | 108 |
| Operating Expenses | 105 | 104 | 114 | 267 | 134 |
| Grants & Subsidies | 0 | 0 | 147 | 76 | 200 |
| TOTAL | 2,015 | 2,119 | 2,102 | 2,226 | 3,374 |
FY2016 Spending Category Chart
