|
FY2016 House 1 |
FY2016 House Final |
FY2016 Senate Final |
FY2016 GAA |
|
|---|---|---|---|---|
| Budget Tracking | 13,712,441 | 13,712,441 | 14,097,362 | 13,842,635 |
|
FY2013 GAA |
FY2014 GAA |
FY2015 GAA |
FY2015 Projected |
FY2016 GAA |
|
|---|---|---|---|---|---|
| Historical Budget Levels | 11,007,508 | 11,908,005 | 13,146,299 | 13,225,682 | 13,842,635 |
* GAA is General Appropriation Act.
| SPENDING CATEGORY |
FY2012 Expended |
FY2013 Expended |
FY2014 Expended |
FY2015 Projected |
FY2016 GAA |
|---|---|---|---|---|---|
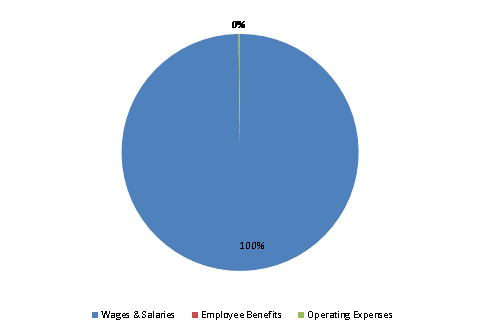
| Wages & Salaries | 11,079 | 11,260 | 11,741 | 13,226 | 13,813 |
| Employee Benefits | 217 | 145 | 167 | 0 | 2 |
| Operating Expenses | 0 | 0 | 0 | 0 | 28 |
| TOTAL | 11,296 | 11,405 | 11,908 | 13,226 | 13,843 |
FY2016 Spending Category Chart
