|
FY2016 House 1 |
FY2016 House Final |
FY2016 Senate Final |
FY2016 GAA |
|
|---|---|---|---|---|
| Budget Tracking | 20,227,372 | 20,227,372 | 20,606,272 | 20,227,372 |
|
FY2013 GAA |
FY2014 GAA |
FY2015 GAA |
FY2015 Projected |
FY2016 GAA |
|
|---|---|---|---|---|---|
| Historical Budget Levels | 17,376,153 | 18,884,986 | 19,760,055 | 19,894,322 | 20,227,372 |
* GAA is General Appropriation Act.
| SPENDING CATEGORY |
FY2012 Expended |
FY2013 Expended |
FY2014 Expended |
FY2015 Projected |
FY2016 GAA |
|---|---|---|---|---|---|
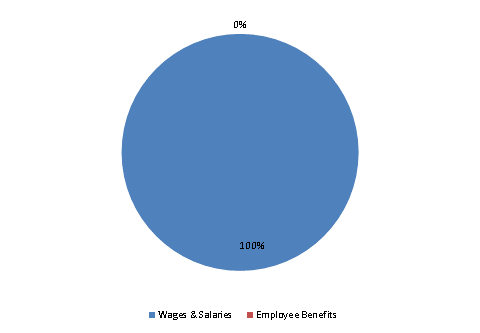
| Wages & Salaries | 17,301 | 17,827 | 18,606 | 19,894 | 20,224 |
| Employee Benefits | 336 | 230 | 264 | 0 | 3 |
| TOTAL | 17,636 | 18,057 | 18,870 | 19,894 | 20,227 |
FY2016 Spending Category Chart
