|
FY2016 House 1 |
FY2016 House Final |
FY2016 Senate Final |
FY2016 GAA |
|
|---|---|---|---|---|
| Budget Tracking | 25,276,495 | 25,276,495 | 25,369,660 | 25,276,495 |
|
FY2013 GAA |
FY2014 GAA |
FY2015 GAA |
FY2015 Projected |
FY2016 GAA |
|
|---|---|---|---|---|---|
| Historical Budget Levels | 19,941,794 | 24,128,143 | 24,128,143 | 24,693,461 | 25,276,495 |
* GAA is General Appropriation Act.
| SPENDING CATEGORY |
FY2012 Expended |
FY2013 Expended |
FY2014 Expended |
FY2015 Projected |
FY2016 GAA |
|---|---|---|---|---|---|
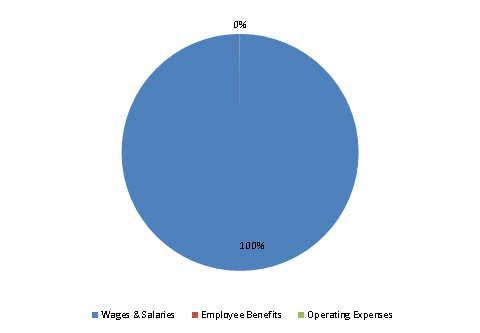
| Wages & Salaries | 19,562 | 20,909 | 23,790 | 24,693 | 25,266 |
| Employee Benefits | 379 | 270 | 338 | 0 | 4 |
| Operating Expenses | 0 | 0 | 0 | 0 | 7 |
| TOTAL | 19,941 | 21,179 | 24,128 | 24,693 | 25,276 |
FY2016 Spending Category Chart
