|
FY2016 House 1 |
FY2016 House Final |
FY2016 Senate Final |
FY2016 GAA |
|
|---|---|---|---|---|
| Budget Tracking | 0 | 750,000 | 750,000 | 750,000 |
|
FY2013 GAA |
FY2014 GAA |
FY2015 GAA |
FY2015 Projected |
FY2016 GAA |
|
|---|---|---|---|---|---|
| Historical Budget Levels | 650,000 | 550,000 | 750,000 | 750,000 | 750,000 |
* GAA is General Appropriation Act.
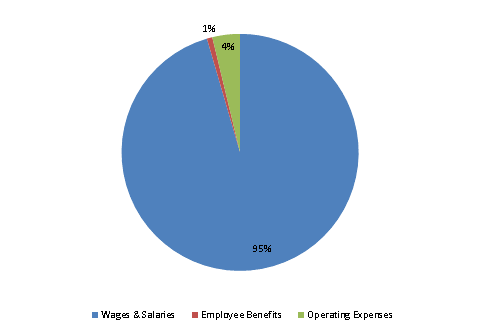
| SPENDING CATEGORY |
FY2012 Expended |
FY2013 Expended |
FY2014 Expended |
FY2015 Projected |
FY2016 GAA |
|---|---|---|---|---|---|
| Wages & Salaries | 0 | 617 | 544 | 0 | 716 |
| Employee Benefits | 0 | 1 | 0 | 0 | 6 |
| Operating Expenses | 0 | 32 | 5 | 0 | 28 |
| Grants & Subsidies | 0 | 0 | 0 | 750 | 0 |
| TOTAL | 0 | 650 | 550 | 750 | 750 |
FY2016 Spending Category Chart