|
FY2016 House 1 |
FY2016 House Final |
FY2016 Senate Final |
FY2016 GAA |
|
|---|---|---|---|---|
| Budget Tracking | 526,556,901 | 518,905,373 | 537,783,600 | 531,807,373 |
|
FY2013 GAA |
FY2014 GAA |
FY2015 GAA |
FY2015 Projected |
FY2016 GAA |
|
|---|---|---|---|---|---|
| Historical Budget Levels | 418,107,753 | 478,891,873 | 519,005,373 | 519,005,373 | 531,807,373 |
* GAA is General Appropriation Act.
| SPENDING CATEGORY |
FY2012 Expended |
FY2013 Expended |
FY2014 Expended |
FY2015 Projected |
FY2016 GAA |
|---|---|---|---|---|---|
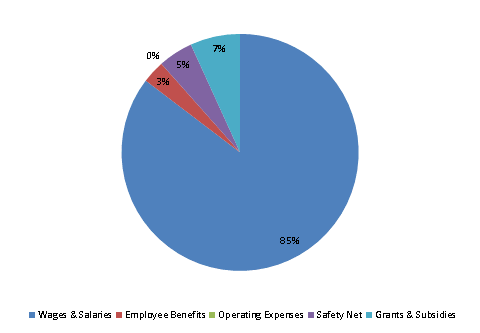
| Wages & Salaries | 417,979 | 443,620 | 478,742 | 441,875 | 453,908 |
| Employee Benefits | 4 | 0 | 0 | 16,239 | 16,401 |
| Operating Expenses | 0 | 0 | 0 | 4 | 4 |
| Safety Net | 0 | 125 | 150 | 25,010 | 25,260 |
| Grants & Subsidies | 0 | 0 | 0 | 35,877 | 36,235 |
| TOTAL | 417,983 | 443,745 | 478,892 | 519,005 | 531,807 |
FY2016 Spending Category Chart
