|
FY2016 House 1 |
FY2016 House Final |
FY2016 Senate Final |
FY2016 GAA |
|
|---|---|---|---|---|
| Budget Tracking | 2,591,476 | 3,054,371 | 3,249,334 | 4,449,334 |
|
FY2013 GAA |
FY2014 GAA |
FY2015 GAA |
FY2015 Projected |
FY2016 GAA |
|
|---|---|---|---|---|---|
| Historical Budget Levels | 2,953,649 | 3,318,529 | 3,249,334 | 2,666,734 | 4,449,334 |
* GAA is General Appropriation Act.
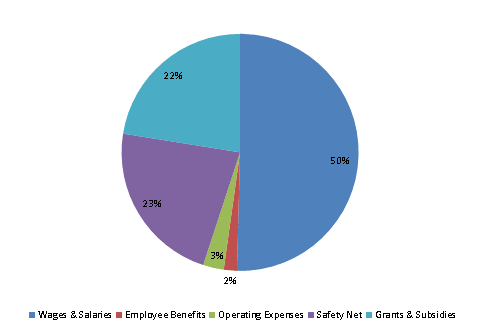
| SPENDING CATEGORY |
FY2012 Expended |
FY2013 Expended |
FY2014 Expended |
FY2015 Projected |
FY2016 GAA |
|---|---|---|---|---|---|
| Wages & Salaries | 1,520 | 1,756 | 2,088 | 1,972 | 2,243 |
| Employee Benefits | 46 | 45 | 64 | 48 | 79 |
| Operating Expenses | 53 | 145 | 59 | 147 | 127 |
| Safety Net | 0 | 500 | 1,000 | 500 | 1,000 |
| Grants & Subsidies | 0 | 0 | 100 | 0 | 1,000 |
| TOTAL | 1,619 | 2,446 | 3,311 | 2,667 | 4,449 |
FY2016 Spending Category Chart