|
FY2016 House 1 |
FY2016 House Final |
FY2016 Senate Final |
FY2016 GAA |
|
|---|---|---|---|---|
| Budget Tracking | 30,036,166 | 30,431,340 | 31,224,160 | 31,249,160 |
|
FY2013 GAA |
FY2014 GAA |
FY2015 GAA |
FY2015 Projected |
FY2016 GAA |
|
|---|---|---|---|---|---|
| Historical Budget Levels | 30,174,160 | 30,174,160 | 30,374,160 | 29,668,648 | 31,249,160 |
* GAA is General Appropriation Act.
| SPENDING CATEGORY |
FY2012 Expended |
FY2013 Expended |
FY2014 Expended |
FY2015 Projected |
FY2016 GAA |
|---|---|---|---|---|---|
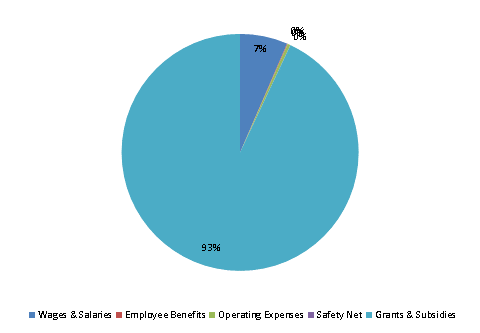
| Wages & Salaries | 2,013 | 2,065 | 2,076 | 2,010 | 2,028 |
| Employee Benefits | 21 | 18 | 15 | 24 | 31 |
| Operating Expenses | 88 | 113 | 182 | 118 | 121 |
| Safety Net | 0 | 0 | 0 | 6 | 6 |
| Grants & Subsidies | 28,474 | 27,917 | 27,792 | 27,510 | 29,064 |
| TOTAL | 30,595 | 30,113 | 30,064 | 29,669 | 31,249 |
FY2016 Spending Category Chart
