|
FY2016 House 1 |
FY2016 House Final |
FY2016 Senate Final |
FY2016 GAA |
|
|---|---|---|---|---|
| Budget Tracking | 6,146,956 | 11,615,000 | 12,110,000 | 14,590,000 |
|
FY2013 GAA |
FY2014 GAA |
FY2015 GAA |
FY2015 Projected |
FY2016 GAA |
|
|---|---|---|---|---|---|
| Historical Budget Levels | 7,217,109 | 13,644,651 | 18,235,161 | 13,599,823 | 14,590,000 |
* GAA is General Appropriation Act.
| SPENDING CATEGORY |
FY2012 Expended |
FY2013 Expended |
FY2014 Expended |
FY2015 Projected |
FY2016 GAA |
|---|---|---|---|---|---|
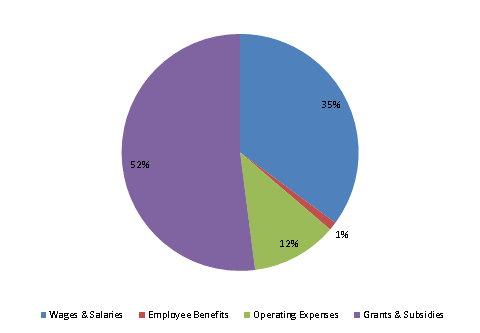
| Wages & Salaries | 1,400 | 3,302 | 8,514 | 9,474 | 5,126 |
| Employee Benefits | 31 | 41 | 44 | 62 | 167 |
| Operating Expenses | 230 | 492 | 713 | 831 | 1,708 |
| Grants & Subsidies | 377 | 3,487 | 4,612 | 3,233 | 7,590 |
| TOTAL | 2,039 | 7,322 | 13,884 | 13,600 | 14,590 |
FY2016 Spending Category Chart
