|
FY2016 House 1 |
FY2016 House Final |
FY2016 Senate Final |
FY2016 GAA |
|
|---|---|---|---|---|
| Budget Tracking | 896,173 | 845,270 | 897,363 | 845,270 |
|
FY2013 GAA |
FY2014 GAA |
FY2015 GAA |
FY2015 Projected |
FY2016 GAA |
|
|---|---|---|---|---|---|
| Historical Budget Levels | 749,534 | 793,434 | 829,266 | 829,266 | 845,270 |
* GAA is General Appropriation Act.
| SPENDING CATEGORY |
FY2012 Expended |
FY2013 Expended |
FY2014 Expended |
FY2015 Projected |
FY2016 GAA |
|---|---|---|---|---|---|
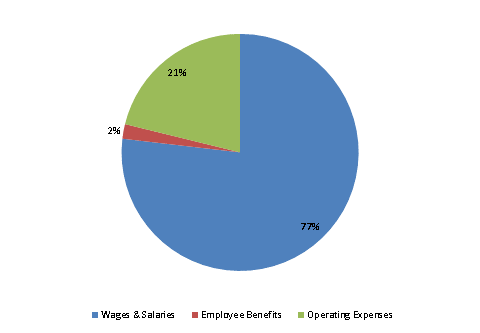
| Wages & Salaries | 534 | 587 | 635 | 636 | 650 |
| Employee Benefits | 17 | 14 | 15 | 17 | 17 |
| Operating Expenses | 147 | 137 | 141 | 177 | 179 |
| TOTAL | 697 | 738 | 791 | 829 | 845 |
FY2016 Spending Category Chart
