|
FY2016 House 1 |
FY2016 House Final |
FY2016 Senate Final |
FY2016 GAA |
|
|---|---|---|---|---|
| Budget Tracking | 970,176 | 837,584 | 870,176 | 837,584 |
|
FY2013 GAA |
FY2014 GAA |
FY2015 GAA |
FY2015 Projected |
FY2016 GAA |
|
|---|---|---|---|---|---|
| Historical Budget Levels | 846,160 | 837,584 | 837,584 | 823,585 | 837,584 |
* GAA is General Appropriation Act.
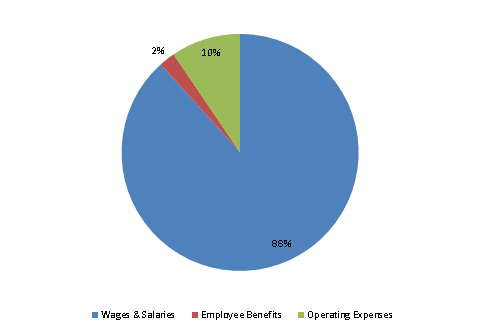
| SPENDING CATEGORY |
FY2012 Expended |
FY2013 Expended |
FY2014 Expended |
FY2015 Projected |
FY2016 GAA |
|---|---|---|---|---|---|
| Wages & Salaries | 674 | 725 | 709 | 727 | 740 |
| Employee Benefits | 20 | 15 | 14 | 17 | 18 |
| Operating Expenses | 56 | 59 | 69 | 80 | 80 |
| TOTAL | 750 | 800 | 792 | 824 | 838 |
FY2016 Spending Category Chart