|
FY2016 House 1 |
FY2016 House Final |
FY2016 Senate Final |
FY2016 GAA |
|
|---|---|---|---|---|
| Budget Tracking | 7,250,142 | 8,142,359 | 8,272,360 | 8,687,359 |
|
FY2013 GAA |
FY2014 GAA |
FY2015 GAA |
FY2015 Projected |
FY2016 GAA |
|
|---|---|---|---|---|---|
| Historical Budget Levels | 7,289,734 | 6,647,129 | 7,785,144 | 6,952,751 | 8,687,359 |
* GAA is General Appropriation Act.
| SPENDING CATEGORY |
FY2012 Expended |
FY2013 Expended |
FY2014 Expended |
FY2015 Projected |
FY2016 GAA |
|---|---|---|---|---|---|
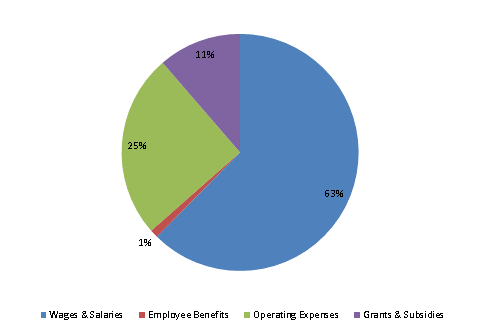
| Wages & Salaries | 4,204 | 4,569 | 4,006 | 4,242 | 5,421 |
| Employee Benefits | 96 | 70 | 69 | 84 | 96 |
| Operating Expenses | 2,125 | 2,202 | 2,168 | 2,002 | 2,186 |
| Safety Net | 2,192 | 213 | 0 | 0 | 0 |
| Grants & Subsidies | 10 | 172 | 600 | 625 | 985 |
| TOTAL | 8,628 | 7,226 | 6,842 | 6,953 | 8,687 |
FY2016 Spending Category Chart
