|
FY2016 House 1 |
FY2016 House Final |
FY2016 Senate Final |
FY2016 GAA |
|
|---|---|---|---|---|
| Budget Tracking | 4,400,000 | 4,000,000 | 5,050,982 | 4,525,491 |
|
FY2013 GAA |
FY2014 GAA |
FY2015 GAA |
FY2015 Projected |
FY2016 GAA |
|
|---|---|---|---|---|---|
| Historical Budget Levels | 4,494,467 | 4,494,467 | 5,050,982 | 4,432,573 | 4,525,491 |
* GAA is General Appropriation Act.
| SPENDING CATEGORY |
FY2012 Expended |
FY2013 Expended |
FY2014 Expended |
FY2015 Projected |
FY2016 GAA |
|---|---|---|---|---|---|
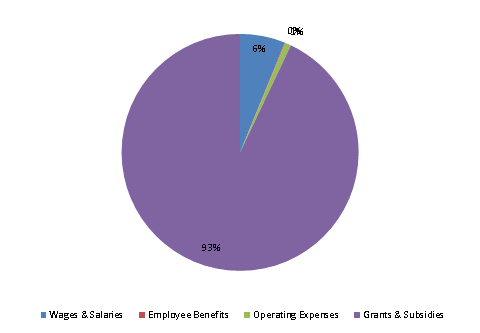
| Wages & Salaries | 525 | 350 | 370 | 265 | 278 |
| Employee Benefits | 10 | 17 | 5 | 4 | 4 |
| Operating Expenses | 118 | 285 | 75 | 37 | 37 |
| Grants & Subsidies | 3,841 | 3,831 | 4,041 | 4,127 | 4,206 |
| TOTAL | 4,494 | 4,484 | 4,491 | 4,433 | 4,525 |
FY2016 Spending Category Chart
