|
FY2016 House 1 |
FY2016 House Final |
FY2016 Senate Final |
FY2016 GAA |
|
|---|---|---|---|---|
| Budget Tracking | 285,540 | 272,619 | 285,540 | 272,619 |
|
FY2013 GAA |
FY2014 GAA |
FY2015 GAA |
FY2015 Projected |
FY2016 GAA |
|
|---|---|---|---|---|---|
| Historical Budget Levels | 227,297 | 279,756 | 283,876 | 199,197 | 272,619 |
* GAA is General Appropriation Act.
| SPENDING CATEGORY |
FY2012 Expended |
FY2013 Expended |
FY2014 Expended |
FY2015 Projected |
FY2016 GAA |
|---|---|---|---|---|---|
| Wages & Salaries | 114 | 113 | 118 | 69 | 143 |
| Employee Benefits | 2 | 2 | 2 | 2 | 2 |
| Operating Expenses | 124 | 107 | 155 | 128 | 128 |
| TOTAL | 240 | 222 | 274 | 199 | 273 |
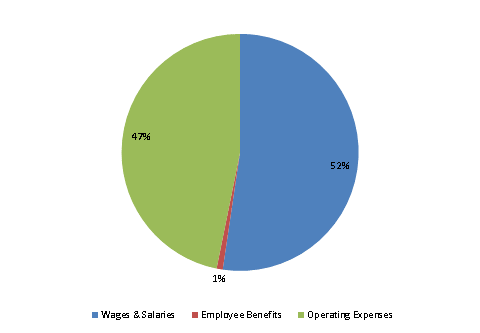
FY2016 Spending Category Chart