|
FY2016 House 1 |
FY2016 House Final |
FY2016 Senate Final |
FY2016 GAA |
|
|---|---|---|---|---|
| Budget Tracking | 3,317,283 | 3,317,283 | 3,312,056 | 3,312,056 |
|
FY2013 GAA |
FY2014 GAA |
FY2015 GAA |
FY2015 Projected |
FY2016 GAA |
|
|---|---|---|---|---|---|
| Historical Budget Levels | 2,976,536 | 3,035,008 | 3,252,723 | 3,227,723 | 3,312,056 |
* GAA is General Appropriation Act.
| SPENDING CATEGORY |
FY2012 Expended |
FY2013 Expended |
FY2014 Expended |
FY2015 Projected |
FY2016 GAA |
|---|---|---|---|---|---|
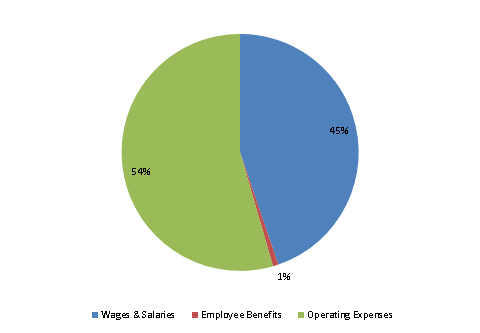
| Wages & Salaries | 1,196 | 1,254 | 1,267 | 1,400 | 1,483 |
| Employee Benefits | 23 | 17 | 18 | 24 | 25 |
| Operating Expenses | 882 | 1,499 | 1,651 | 1,805 | 1,805 |
| TOTAL | 2,101 | 2,770 | 2,936 | 3,228 | 3,312 |
FY2016 Spending Category Chart
