|
FY2016 House 1 |
FY2016 House Final |
FY2016 Senate Final |
FY2016 GAA |
|
|---|---|---|---|---|
| Budget Tracking | 112,092,315 | 110,998,314 | 111,092,314 | 110,998,314 |
|
FY2013 GAA |
FY2014 GAA |
FY2015 GAA |
FY2015 Projected |
FY2016 GAA |
|
|---|---|---|---|---|---|
| Historical Budget Levels | 133,442,770 | 122,672,119 | 107,480,864 | 112,467,121 | 110,998,314 |
* GAA is General Appropriation Act.
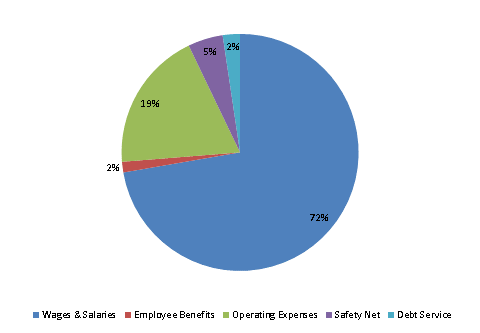
| SPENDING CATEGORY |
FY2012 Expended |
FY2013 Expended |
FY2014 Expended |
FY2015 Projected |
FY2016 GAA |
|---|---|---|---|---|---|
| Wages & Salaries | 105,925 | 96,101 | 92,458 | 78,393 | 80,235 |
| Employee Benefits | 2,763 | 1,702 | 1,750 | 1,603 | 1,608 |
| Operating Expenses | 35,489 | 28,638 | 26,681 | 23,669 | 21,243 |
| Safety Net | 6,425 | 7,077 | 7,569 | 5,767 | 5,301 |
| Debt Service | 0 | 0 | 367 | 3,034 | 2,611 |
| TOTAL | 150,602 | 133,518 | 128,825 | 112,467 | 110,998 |
FY2016 Spending Category Chart