|
FY2016 House 1 |
FY2016 House Final |
FY2016 Senate Final |
FY2016 GAA |
|
|---|---|---|---|---|
| Budget Tracking | 214,737,045 | 214,737,045 | 214,737,045 | 214,737,045 |
|
FY2013 GAA |
FY2014 GAA |
FY2015 GAA |
FY2015 Projected |
FY2016 GAA |
|
|---|---|---|---|---|---|
| Historical Budget Levels | 180,836,026 | 189,938,363 | 206,309,615 | 209,613,980 | 214,737,045 |
* GAA is General Appropriation Act.
| SPENDING CATEGORY |
FY2012 Expended |
FY2013 Expended |
FY2014 Expended |
FY2015 Projected |
FY2016 GAA |
|---|---|---|---|---|---|
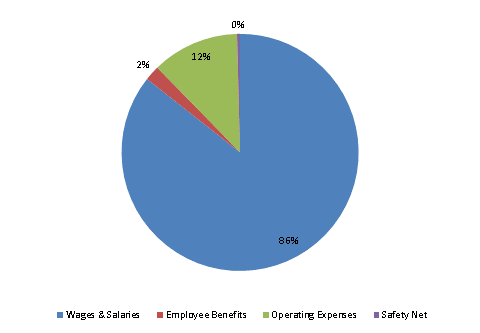
| Wages & Salaries | 140,103 | 156,289 | 165,941 | 178,619 | 183,860 |
| Employee Benefits | 4,007 | 3,437 | 4,072 | 4,369 | 4,419 |
| Operating Expenses | 19,704 | 21,929 | 22,340 | 25,735 | 25,567 |
| Safety Net | 674 | 597 | 645 | 891 | 891 |
| TOTAL | 164,488 | 182,252 | 192,998 | 209,614 | 214,737 |
FY2016 Spending Category Chart
