|
FY2016 House 1 |
FY2016 House Final |
FY2016 Senate Final |
FY2016 GAA |
|
|---|---|---|---|---|
| Budget Tracking | 69,918,985 | 69,381,154 | 69,646,985 | 69,596,985 |
|
FY2013 GAA |
FY2014 GAA |
FY2015 GAA |
FY2015 Projected |
FY2016 GAA |
|
|---|---|---|---|---|---|
| Historical Budget Levels | 63,087,273 | 64,042,324 | 65,690,438 | 65,413,909 | 69,596,985 |
* GAA is General Appropriation Act.
| SPENDING CATEGORY |
FY2012 Expended |
FY2013 Expended |
FY2014 Expended |
FY2015 Projected |
FY2016 GAA |
|---|---|---|---|---|---|
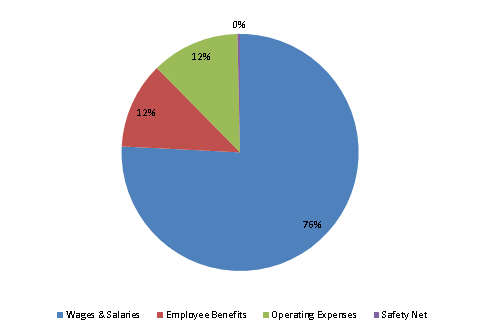
| Wages & Salaries | 46,608 | 47,829 | 49,031 | 49,907 | 52,756 |
| Employee Benefits | 7,184 | 7,079 | 7,252 | 7,833 | 8,224 |
| Operating Expenses | 7,026 | 6,842 | 7,211 | 7,474 | 8,367 |
| Safety Net | 0 | 100 | 100 | 200 | 250 |
| TOTAL | 60,818 | 61,850 | 63,594 | 65,414 | 69,597 |
FY2016 Spending Category Chart
