|
FY2016 House 1 |
FY2016 House Final |
FY2016 Senate Final |
FY2016 GAA |
|
|---|---|---|---|---|
| Budget Tracking | 191,466,966 | 191,466,966 | 190,325,165 | 190,325,165 |
|
FY2013 GAA |
FY2014 GAA |
FY2015 GAA |
FY2015 Projected |
FY2016 GAA |
|
|---|---|---|---|---|---|
| Historical Budget Levels | 159,313,321 | 173,116,512 | 183,883,536 | 182,773,537 | 190,325,165 |
* GAA is General Appropriation Act.
| SPENDING CATEGORY |
FY2012 Expended |
FY2013 Expended |
FY2014 Expended |
FY2015 Projected |
FY2016 GAA |
|---|---|---|---|---|---|
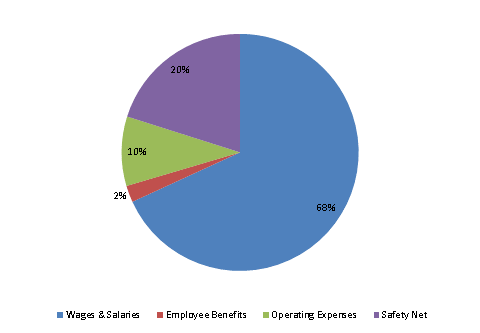
| Wages & Salaries | 99,249 | 109,375 | 113,342 | 123,538 | 129,703 |
| Employee Benefits | 2,569 | 2,529 | 4,023 | 4,149 | 4,331 |
| Operating Expenses | 12,310 | 13,455 | 16,293 | 17,125 | 18,029 |
| Safety Net | 29,430 | 32,443 | 36,343 | 37,962 | 38,262 |
| TOTAL | 143,558 | 157,802 | 170,003 | 182,774 | 190,325 |
FY2016 Spending Category Chart
