|
FY2016 House 1 |
FY2016 House Final |
FY2016 Senate Final |
FY2016 GAA |
|
|---|---|---|---|---|
| Budget Tracking | 24,258,428 | 24,258,428 | 24,258,428 | 24,258,428 |
|
FY2013 GAA |
FY2014 GAA |
FY2015 GAA |
FY2015 Projected |
FY2016 GAA |
|
|---|---|---|---|---|---|
| Historical Budget Levels | 35,242,254 | 35,526,443 | 36,416,490 | 31,402,706 | 24,258,428 |
* GAA is General Appropriation Act.
| SPENDING CATEGORY |
FY2012 Expended |
FY2013 Expended |
FY2014 Expended |
FY2015 Projected |
FY2016 GAA |
|---|---|---|---|---|---|
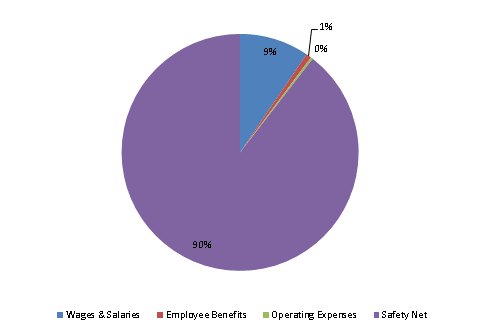
| Wages & Salaries | 1,985 | 2,313 | 2,738 | 3,107 | 2,301 |
| Employee Benefits | 92 | 91 | 111 | 171 | 173 |
| Operating Expenses | 34 | 61 | 49 | 74 | 74 |
| Safety Net | 32,485 | 31,566 | 31,986 | 28,051 | 21,710 |
| TOTAL | 34,596 | 34,031 | 34,884 | 31,403 | 24,258 |
FY2016 Spending Category Chart
