|
FY2016 House 1 |
FY2016 House Final |
FY2016 Senate Final |
FY2016 GAA |
|
|---|---|---|---|---|
| Budget Tracking | 80,420,672 | 86,422,266 | 87,034,610 | 87,034,610 |
|
FY2013 GAA |
FY2014 GAA |
FY2015 GAA |
FY2015 Projected |
FY2016 GAA |
|
|---|---|---|---|---|---|
| Historical Budget Levels | 76,816,757 | 85,222,740 | 87,567,266 | 80,420,672 | 87,034,610 |
* GAA is General Appropriation Act.
| SPENDING CATEGORY |
FY2012 Expended |
FY2013 Expended |
FY2014 Expended |
FY2015 Projected |
FY2016 GAA |
|---|---|---|---|---|---|
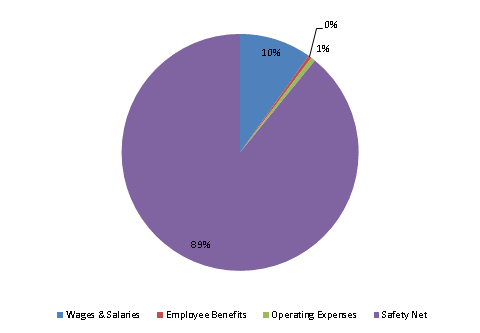
| Wages & Salaries | 6,225 | 6,203 | 6,629 | 7,938 | 8,549 |
| Employee Benefits | 363 | 315 | 334 | 384 | 391 |
| Operating Expenses | 234 | 461 | 252 | 441 | 527 |
| Safety Net | 62,577 | 61,416 | 64,089 | 71,658 | 77,568 |
| TOTAL | 69,400 | 68,395 | 71,304 | 80,421 | 87,035 |
FY2016 Spending Category Chart
