|
FY2016 House 1 |
FY2016 House Final |
FY2016 Senate Final |
FY2016 GAA |
|
|---|---|---|---|---|
| Budget Tracking | 28,720,221 | 28,720,222 | 28,570,221 | 28,570,221 |
|
FY2013 GAA |
FY2014 GAA |
FY2015 GAA |
FY2015 Projected |
FY2016 GAA |
|
|---|---|---|---|---|---|
| Historical Budget Levels | 27,373,198 | 27,275,844 | 28,098,283 | 28,048,283 | 28,570,221 |
* GAA is General Appropriation Act.
| SPENDING CATEGORY |
FY2012 Expended |
FY2013 Expended |
FY2014 Expended |
FY2015 Projected |
FY2016 GAA |
|---|---|---|---|---|---|
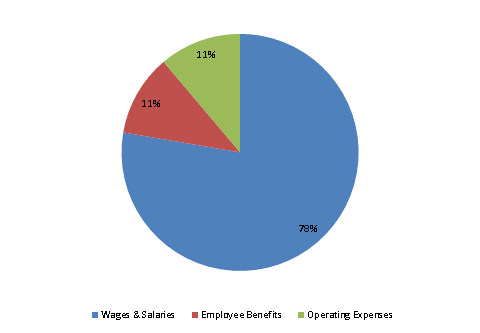
| Wages & Salaries | 18,061 | 19,239 | 21,107 | 21,834 | 22,198 |
| Employee Benefits | 4,177 | 3,989 | 3,018 | 3,091 | 3,180 |
| Operating Expenses | 3,215 | 3,287 | 2,886 | 3,124 | 3,192 |
| TOTAL | 25,453 | 26,515 | 27,010 | 28,048 | 28,570 |
FY2016 Spending Category Chart
