|
FY2016 House 1 |
FY2016 House Final |
FY2016 Senate Final |
FY2016 GAA |
|
|---|---|---|---|---|
| Budget Tracking | 23,972,020 | 26,148,905 | 24,298,905 | 26,148,905 |
|
FY2013 GAA |
FY2014 GAA |
FY2015 GAA |
FY2015 Projected |
FY2016 GAA |
|
|---|---|---|---|---|---|
| Historical Budget Levels | 21,455,430 | 22,905,532 | 24,448,905 | 23,808,905 | 26,148,905 |
* GAA is General Appropriation Act.
| SPENDING CATEGORY |
FY2012 Expended |
FY2013 Expended |
FY2014 Expended |
FY2015 Projected |
FY2016 GAA |
|---|---|---|---|---|---|
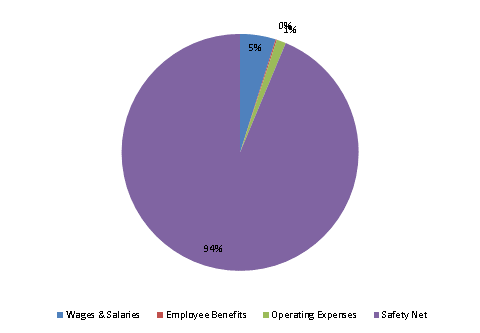
| Wages & Salaries | 1,163 | 1,214 | 1,240 | 1,246 | 1,269 |
| Employee Benefits | 48 | 38 | 41 | 45 | 45 |
| Operating Expenses | 242 | 256 | 255 | 315 | 334 |
| Safety Net | 19,206 | 18,959 | 20,657 | 22,204 | 24,501 |
| TOTAL | 20,659 | 20,466 | 22,193 | 23,809 | 26,149 |
FY2016 Spending Category Chart
