|
FY2016 House 1 |
FY2016 House Final |
FY2016 Senate Final |
FY2016 GAA |
|
|---|---|---|---|---|
| Budget Tracking | 3,247,347 | 3,226,629 | 3,247,347 | 3,226,629 |
|
FY2013 GAA |
FY2014 GAA |
FY2015 GAA |
FY2015 Projected |
FY2016 GAA |
|
|---|---|---|---|---|---|
| Historical Budget Levels | 2,943,098 | 2,995,812 | 3,028,757 | 3,125,044 | 3,226,629 |
* GAA is General Appropriation Act.
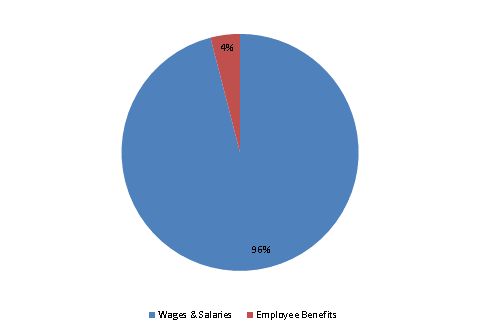
| SPENDING CATEGORY |
FY2012 Expended |
FY2013 Expended |
FY2014 Expended |
FY2015 Projected |
FY2016 GAA |
|---|---|---|---|---|---|
| Wages & Salaries | 2,595 | 2,734 | 2,821 | 2,993 | 3,097 |
| Employee Benefits | 147 | 102 | 119 | 127 | 130 |
| Operating Expenses | 1 | 2 | 4 | 5 | 0 |
| TOTAL | 2,743 | 2,838 | 2,944 | 3,125 | 3,227 |
FY2016 Spending Category Chart