|
FY2016 House 1 |
FY2016 House Final |
FY2016 Senate Final |
FY2016 GAA |
|
|---|---|---|---|---|
| Budget Tracking | 80,703,822 | 80,703,821 | 81,023,822 | 81,023,822 |
|
FY2013 GAA |
FY2014 GAA |
FY2015 GAA |
FY2015 Projected |
FY2016 GAA |
|
|---|---|---|---|---|---|
| Historical Budget Levels | 67,351,557 | 68,828,898 | 74,871,347 | 75,441,034 | 81,023,822 |
* GAA is General Appropriation Act.
| SPENDING CATEGORY |
FY2012 Expended |
FY2013 Expended |
FY2014 Expended |
FY2015 Projected |
FY2016 GAA |
|---|---|---|---|---|---|
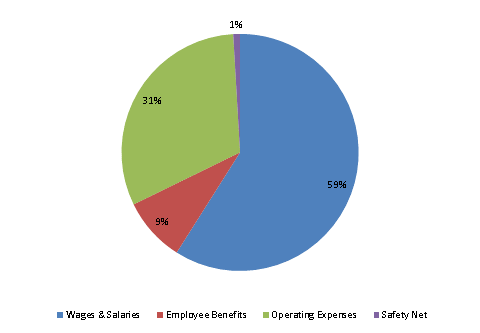
| Wages & Salaries | 39,464 | 40,321 | 41,592 | 45,467 | 47,788 |
| Employee Benefits | 5,944 | 5,330 | 6,193 | 6,344 | 7,113 |
| Operating Expenses | 20,073 | 20,261 | 22,274 | 23,130 | 25,373 |
| Safety Net | 0 | 0 | 0 | 500 | 750 |
| TOTAL | 65,481 | 65,912 | 70,059 | 75,441 | 81,024 |
FY2016 Spending Category Chart
