|
FY2016 House 1 |
FY2016 House Final |
FY2016 Senate Final |
FY2016 GAA |
|
|---|---|---|---|---|
| Budget Tracking | 12,285,974 | 12,307,055 | 12,230,974 | 12,230,974 |
|
FY2013 GAA |
FY2014 GAA |
FY2015 GAA |
FY2015 Projected |
FY2016 GAA |
|
|---|---|---|---|---|---|
| Historical Budget Levels | 11,597,967 | 12,347,967 | 12,377,055 | 12,257,055 | 12,230,974 |
* GAA is General Appropriation Act.
| SPENDING CATEGORY |
FY2012 Expended |
FY2013 Expended |
FY2014 Expended |
FY2015 Projected |
FY2016 GAA |
|---|---|---|---|---|---|
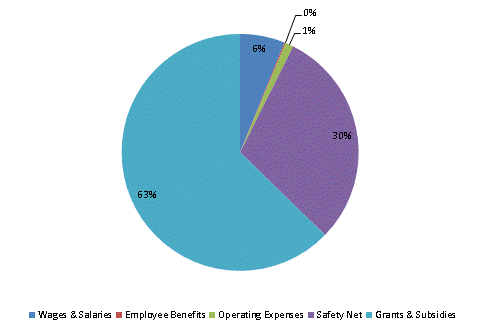
| Wages & Salaries | 575 | 611 | 687 | 720 | 749 |
| Employee Benefits | 16 | 14 | 14 | 19 | 20 |
| Operating Expenses | 141 | 131 | 133 | 137 | 137 |
| Safety Net | 3,506 | 3,605 | 3,834 | 3,709 | 3,654 |
| Grants & Subsidies | 7,346 | 7,299 | 7,647 | 7,671 | 7,671 |
| TOTAL | 11,585 | 11,660 | 12,315 | 12,257 | 12,231 |
FY2016 Spending Category Chart
