|
FY2016 House 1 |
FY2016 House Final |
FY2016 Senate Final |
FY2016 GAA |
|
|---|---|---|---|---|
| Budget Tracking | 1,955,811 | 1,955,811 | 1,955,811 | 1,955,811 |
|
FY2013 GAA |
FY2014 GAA |
FY2015 GAA |
FY2015 Projected |
FY2016 GAA |
|
|---|---|---|---|---|---|
| Historical Budget Levels | 2,197,411 | 2,200,256 | 2,126,667 | 2,054,850 | 1,955,811 |
* GAA is General Appropriation Act.
| SPENDING CATEGORY |
FY2012 Expended |
FY2013 Expended |
FY2014 Expended |
FY2015 Projected |
FY2016 GAA |
|---|---|---|---|---|---|
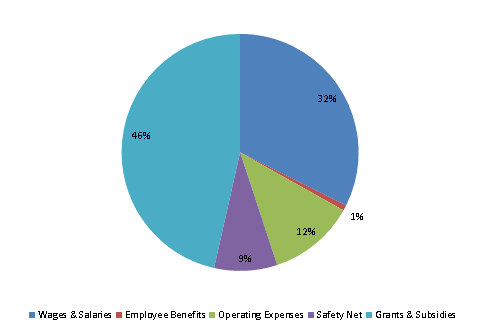
| Wages & Salaries | 871 | 843 | 765 | 707 | 634 |
| Employee Benefits | 17 | 12 | 12 | 12 | 14 |
| Operating Expenses | 287 | 236 | 251 | 231 | 231 |
| Safety Net | 168 | 165 | 1,116 | 168 | 168 |
| Grants & Subsidies | 928 | 916 | 905 | 936 | 909 |
| TOTAL | 2,271 | 2,173 | 3,048 | 2,055 | 1,956 |
FY2016 Spending Category Chart
