|
FY2016 House 1 |
FY2016 House Final |
FY2016 Senate Final |
FY2016 GAA |
|
|---|---|---|---|---|
| Budget Tracking | 12,848,230 | 13,700,641 | 12,848,230 | 12,657,991 |
|
FY2013 GAA |
FY2014 GAA |
FY2015 GAA |
FY2015 Projected |
FY2016 GAA |
|
|---|---|---|---|---|---|
| Historical Budget Levels | 12,129,950 | 12,364,668 | 14,145,385 | 13,186,631 | 12,657,991 |
* GAA is General Appropriation Act.
| SPENDING CATEGORY |
FY2012 Expended |
FY2013 Expended |
FY2014 Expended |
FY2015 Projected |
FY2016 GAA |
|---|---|---|---|---|---|
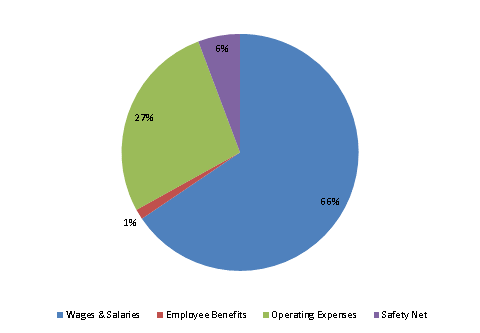
| Wages & Salaries | 7,886 | 7,073 | 7,139 | 7,887 | 8,296 |
| Employee Benefits | 160 | 100 | 113 | 167 | 178 |
| Operating Expenses | 4,008 | 3,911 | 3,987 | 4,257 | 3,459 |
| Safety Net | 808 | 828 | 980 | 876 | 726 |
| TOTAL | 12,862 | 11,912 | 12,219 | 13,187 | 12,658 |
FY2016 Spending Category Chart
