|
FY2016 House 1 |
FY2016 House Final |
FY2016 Senate Final |
FY2016 GAA |
|
|---|---|---|---|---|
| Budget Tracking | 5,024,931 | 5,024,931 | 5,524,931 | 5,624,931 |
|
FY2013 GAA |
FY2014 GAA |
FY2015 GAA |
FY2015 Projected |
FY2016 GAA |
|
|---|---|---|---|---|---|
| Historical Budget Levels | 4,666,697 | 4,921,059 | 5,023,599 | 4,998,119 | 5,624,931 |
* GAA is General Appropriation Act.
| SPENDING CATEGORY |
FY2012 Expended |
FY2013 Expended |
FY2014 Expended |
FY2015 Projected |
FY2016 GAA |
|---|---|---|---|---|---|
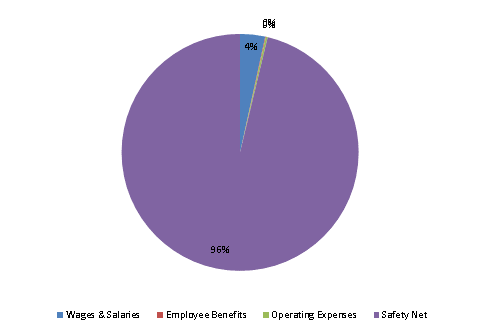
| Wages & Salaries | 122 | 123 | 119 | 190 | 192 |
| Employee Benefits | 4 | 3 | 6 | 5 | 5 |
| Operating Expenses | 13 | 14 | 14 | 14 | 14 |
| Safety Net | 4,511 | 4,410 | 4,729 | 4,789 | 5,414 |
| TOTAL | 4,650 | 4,549 | 4,867 | 4,998 | 5,625 |
FY2016 Spending Category Chart
