|
FY2016 House 1 |
FY2016 House Final |
FY2016 Senate Final |
FY2016 GAA |
|
|---|---|---|---|---|
| Budget Tracking | 90,424,903 | 98,570,501 | 94,569,903 | 98,239,903 |
|
FY2013 GAA |
FY2014 GAA |
FY2015 GAA |
FY2015 Projected |
FY2016 GAA |
|
|---|---|---|---|---|---|
| Historical Budget Levels | 77,164,595 | 83,958,094 | 91,317,333 | 92,221,779 | 98,239,903 |
* GAA is General Appropriation Act.
| SPENDING CATEGORY |
FY2012 Expended |
FY2013 Expended |
FY2014 Expended |
FY2015 Projected |
FY2016 GAA |
|---|---|---|---|---|---|
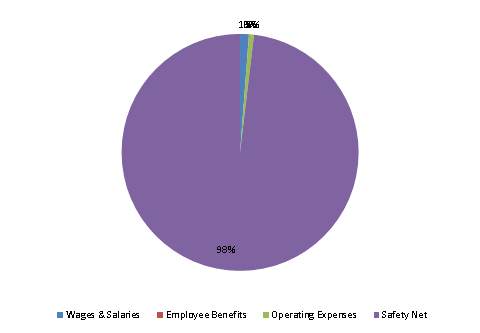
| Wages & Salaries | 1,070 | 1,070 | 1,102 | 1,165 | 1,169 |
| Employee Benefits | 9 | 7 | 6 | 11 | 11 |
| Operating Expenses | 401 | 525 | 551 | 666 | 666 |
| Safety Net | 72,756 | 75,358 | 80,975 | 90,380 | 96,393 |
| Grants & Subsidies | 525 | 0 | 0 | 0 | 0 |
| TOTAL | 74,760 | 76,960 | 82,634 | 92,222 | 98,240 |
FY2016 Spending Category Chart
